作者:王继顺
宝尊电商 DBA,主要负责数据库监控告警以及自动化平台的设计开发工作,擅长数据库性能调优、故障诊断。

背景

随着公司各个环境的服务器数量增加,部署有多套 Prometheus(包括生产、测试、Tidb、Kubernetes 等)集群,在一定集群规模下,普通 Prometheus 集群的承载能力会出现短板(查询速度慢、OOM、以及存储空间不够等问题)。加上公司需要保存双十一、双十二等活动期间的监控数据,来统计活动期间同比环比的监控报表。

SO!我们需要有一个统一的查看各个 Prometheus 监控数据的入口,而且具有不受限制的历史数据存储能力的解决方案,经过多个方案的 POC,最终选用 Thanos 的解决方案并和大家分享一下。

Thanos 介绍

Thanos 的主要特性

1. 全局视图:与现有 Prometheus 设置无缝集成,能够跨集群联合,跨所有连接的 Prometheus 服务器的全局查询视图,很好的对 HA 中的 Prometheus 进行容错路由查询。

2. 不受限的保留数据:支持各种对象存储。

3. 压缩和降准采样:对历史数据进行自定义的降准采样以大幅提高查询速度。

4. 实现包括 Prometheus 在内的各个组件高可用。

5. 能够记录规则,实现告警。

Thanos 架构介绍

Thanos 只有一个二进制启动文件,但是根据启动时候的变量不同分为多个组件,结合架构图,我们来介绍一下各个组件所实现的功能。

Sidecar

Sidecar 必须与 Prometheus 一起部署,实现将 Prometheus 监控数据上传到对象存储,并允许 Querier 查询器高效的查询 Prometheus 数据。

Bucket

Bucket 是用来检测对象存储(Object Storage)的一组工具,以及提供了一个 web 界面,来查看对象存储中的块(Blocks)。对象存储可以选择 GCS(Google Cloud Storage),AWS/S3,Azure Storage Account,OpenStack Swift,Tencent COS,AliYun OSS 等,本文部署实践使用的 S3 作为对象存储。

Store

Store 组件在对象存储上实现 Store API,充当了对象存储的网关,使其与对象存储同步,本地只保留对象存储中所有块的少量的源数据信息。
Querier/Query
Querier 组件实现了 Prometheus http v1 API,完全兼容 Promql 查询,他可以连接 Store 组件和 Sidecar 组件实现从对象存储和 Prometheus 中查询所需数据,并可以从任何实现 Store API 的对象中查询数据。
Querier 组件是完全无状态的查询器,可以水平扩展实现高可用。
Compact
Compact 组件为 Thanos 的压缩器。负责压缩在对象存储中的数据,还负责数据的降准采样。
例:超过 30 天的数据创建 5m 的降准采样(降准采样并不是为了减少存储,而是为了在进行长时间范围查询的时候更快的返回结果)
Rule/Ruler
Rule 组件来定义 Thanos 的告警规则,能够通过 Query 组件进行多套 Promethus 监控值的查询,达到单个 Prometheus 告警阈值的效果。当然还是会有限制,因为 Rule 相比 Prometheus 在本地查询来说,Ruler 分布式的读取远程的 Store API 对象更容易发生查询失败。所以官方还是建议将告警规则保留在 Promethus 中。

本文的部署章节中未涉及 Rule 组件部署。

更多具体信息请参阅:

https://thanos.io/components/rule.md/

Check

Check 组件来检查 Rule 组件使用的规则是否可用,类似于 Promtool check rules

配置

二进制安装包下载
  1. https://github.com/thanos-io/thanos/releases

  1. ./thanos --help

  2. usage: thanos [<flags>] <command> [<args> ...]


  3. A block storage based long-term storage for Prometheus


  4. Flags:

  5. -h, --help Show context-sensitive help (also try --help-long and --help-man).

  6. --version Show application version.

  7. --log.level=info Log filtering level.

  8. --log.format=logfmt Log format to use.

  9. --tracing.config-file=<file-path>

  10. Path to YAML file with tracing configuration. See format details:

  11. https://thanos.io/tracing.md/#configuration

  12. --tracing.config=<content>

  13. Alternative to 'tracing.config-file' flag (lower priority). Content of YAML file with tracing

  14. configuration. See format details: https://thanos.io/tracing.md/#configuration


  15. Commands:

  16. help [<command>...]

  17. Show help.


  18. sidecar [<flags>]

  19. sidecar for Prometheus server


  20. store [<flags>]

  21. store node giving access to blocks in a bucket provider. Now supported GCS, S3, Azure, Swift and Tencent COS.


  22. query [<flags>]

  23. query node exposing PromQL enabled Query API with data retrieved from multiple store nodes


  24. rule [<flags>]

  25. ruler evaluating Prometheus rules against given Query nodes, exposing Store API and storing old blocks in bucket


  26. compact [<flags>]

  27. continuously compacts blocks in an object store bucket


  28. bucket verify [<flags>]

  29. Verify all blocks in the bucket against specified issues


  30. bucket ls [<flags>]

  31. List all blocks in the bucket


  32. bucket inspect [<flags>]

  33. Inspect all blocks in the bucket in detailed, table-like way


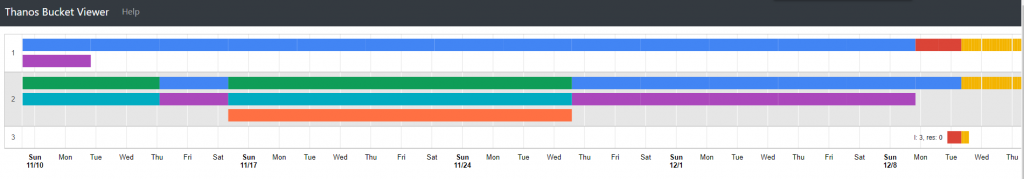
  34. bucket web [<flags>]

  35. Web interface for remote storage bucket


  36. downsample [<flags>]

  37. continuously downsamples blocks in an object store bucket


  38. receive [<flags>]

  39. Accept Prometheus remote write API requests and write to local tsdb (EXPERIMENTAL, this may change drastically without

  40. notice)


  41. check rules <rule-files>...

  42. Check if the rule files are valid or not.

部署

Sidecar

配置 Prometheus
  • 更改配置文件 prometheus.yml 中的 external_labels 并 reload,目的是使用此 labels 在 Thanos 中区分各个不同 Prometheus 集群。

  1. external_labels:

  2. cluster: 'test-cluster'

  3. monitor: "prometheus"

  4. replica: "A"

启动 Promethus

  • 本地 Prometheus 保留 30 天,同时需要添加 –storage.tsdb.min-block-duration=2h –storage.tsdb.max-block-duration=2h 这两个参数(Prometheus 服务器 IP 为 :1.1.1.1.1)

  1. ./prometheus \

  2. --config.file=/data1/deploy/conf/prometheus.yml \

  3. --web.listen-address=:9090 \

  4. --web.external-url=http://0.0.0.0:9090/ \

  5. --web.enable-admin-api \

  6. --log.level=info \

  7. --storage.tsdb.path=/data1/deploy/prometheus2.0.0.data.metrics \

  8. --storage.tsdb.min-block-duration=2h \

  9. --storage.tsdb.max-block-duration=2h \

  10. --storage.tsdb.retention=30d

启动 Sidecar

  1. ./thanos sidecar \

  2. --tsdb.path /data1/deploy/prometheus2.0.0.data.metrics \

  3. --prometheus.url http://localhost:9090 \

  4. --objstore.config-file bucket_config.yaml \

  5. --shipper.upload-compacted

Bucket 配置文件

  1. cat bucket_config.yaml

  2. type: S3

  3. config:

  4. bucket: "bucket的名字"

  5. endpoint: 's3的链接地址'

  6. access_key: "s3的access_key"

  7. insecure: true #是否使用安全协议http或https

  8. signature_version2: false

  9. encrypt_sse: false

  10. secret_key: "s3的scret_key"

  11. put_user_metadata: {}

  12. http_config:

  13. idle_conn_timeout: 90s

  14. response_header_timeout: 2m

  15. insecure_skip_verify: false

  16. trace:

  17. enable: false

  18. part_size: 134217728

  • 启动成功后 Sidecar 组件就会向 S3 发送所有的本地数据以及新在 Prometheus 中落盘的数据。

安装 Store,Query,Compact,Bucket

  • 本文使用单台服务器部署上边四个组件,实现高可用可以使用多台服务器部署(服务器 IP 为 1.2.3.4)

启动 Store
  1. ./thanos store \

  2. --data-dir /service/thanos-0.9.0.linux-amd64/store \

  3. --objstore.config-file bucket_config.yaml \

  4. --http-address 0.0.0.0:19191 \

  5. --grpc-address 0.0.0.0:19090

启动 Query

  1. ./thanos query \

  2. --http-address 0.0.0.0:19193 \

  3. --grpc-address 0.0.0.0:19091 \

  4. --store 1.2.3.4:19090 \ #接入Store

  5. --store 1.1.1.1:10901 #接入Sidecar

启动 Compact

  1. ./thanos compact \

  2. --data-dir /service/thanos-0.9.0.linux-amd64/compact \

  3. --http-address 0.0.0.0:19192 \

  4. --objstore.config-file bucket_config.yaml

至此 Thanos 已经搭建完成!
安装成功后可以访问:
http://1.2.3.4:19193/graph
  • 可以看到界面与 Prometheus 非常相似,完全兼容 Promql,通过 thanos web ui 可以查看所有历史监控数据。

  • 在 store 中可以看到 thanos 集群中接入的 Store 和 Sidecar,并且可以看到目前在 thanos 集群中保留监控数据的最大和最小时间等信息。

启动 Bucket web

Bucket web 是用于检查对象存储块信息的交互式的 web UI
  1. ./thanos bucket web \

  2. --http-address=0.0.0.0:19194 \

  3. --objstore.config-file bucket_config.yaml

安装成功后可以访问:
http://1.2.3.4:19194/

更多信息可以使用 ./thanos –help 来获取

使用

  • 搭建完成后将 Thanos query http 接入 Grafana,实现统一的访问入口,对跨 Prometheus 集群的聚合等操作。

相关链接
官网:https://thanos.io
Github:https://github.com/thanos-io/thanos

社区近期动态

No.1

Mycat 问题免费诊断

诊断范围支持:

Mycat 的故障诊断、源码分析、性能优化

服务支持渠道:

技术交流群,进群后可提问

QQ群(669663113)

社区通道,邮件&电话

osc@actionsky.com

现场拜访,线下实地,1天免费拜访

关注“爱可生开源社区”公众号,回复关键字“Mycat”,获取活动详情。

No.2

社区技术内容征稿

征稿内容:

格式:.md/.doc/.txt

主题:MySQL、分布式中间件DBLE、数据传输组件DTLE相关技术内容

要求:原创且未发布过

奖励:作者署名;200元京东E卡+社区周边

投稿方式:

邮箱:osc@actionsky.com

格式:[投稿]姓名+文章标题

以附件形式发送,正文需注明姓名、手机号、微信号,以便小编及时联系